The Kintronic Labs’ engineering staff has access to a variety of both commercially available and in-house developed design software. This suite of tools permits efficient, flexible, and innovative designs to be applied to all projects, from the small single tower domestic radio station, to megawatt directional arrays in the international market. The staff is continually refining and advancing the tools to accommodate the challenges of more complicated systems and the more stringent requirements for digital broadcast.
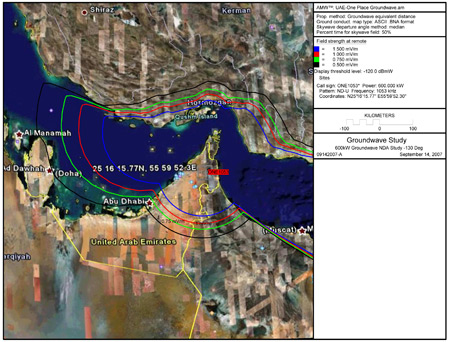
The design process begins with the generation of an antenna pattern. For domestic projects, the pattern is typically provided by a consulting engineer or from the FCC’s database and provides the starting point of the equipment design. For international projects, the Kintronic Labs’ staff can assist in the development of the theoretical pattern and complete the propagation studies for both groundwave and skywave coverage to meet the customer’s needs.
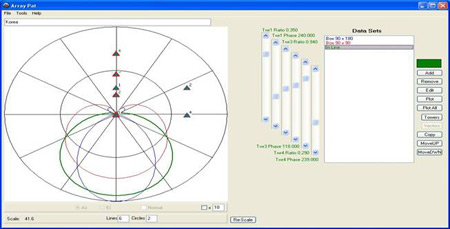
Proprietary software allows theoretical pattern designs to be rapidly evaluated and then translated into a method of moments input file for modeling using NEC 4. Different array geometries can be quickly evaluated and modified to determine their suitability for a particular project, such as the following comparison between two rectangular parallelogram arrangements and the in line array for a 250 KW project.
Theoretical Pattern Comparison Of Three Array Geometries
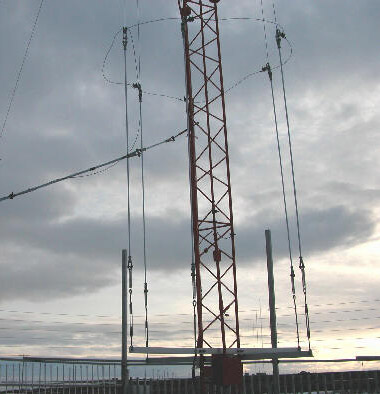
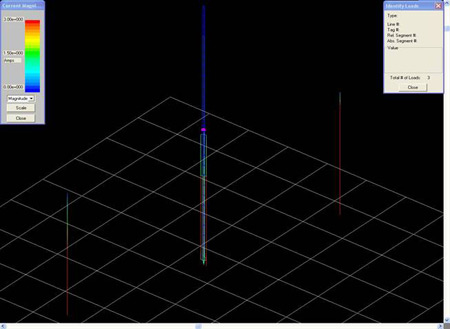
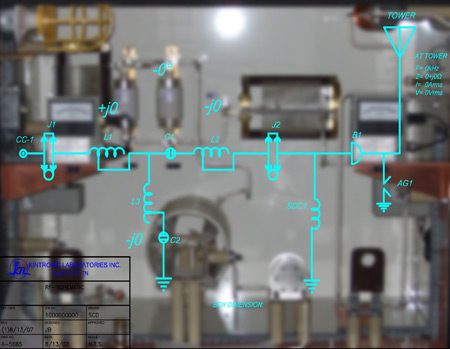
Once the pattern is established, a method of moments model is generated to determine the power division and impedance characteristics associated with the pattern and array. The techniques and tools are flexible, able to accommodate standard series fed antennas, self supporting, and skirted towers such as diamond feeds and unipoles. Unusual geometries including mixed arrays combining series fed towers with skirt fed segmented towers are easily modeled. It is ideal, and in some cases necessary, to have access to measured data in order to refine the model and improve its accuracy. In the example below, the calculated open circuit data from the pictured model compares favorably with field measured data. An accurate model permits a more cost effective RF feed design as well as the opportunity to anticipate potential problems in the field tuning of the array. All Kintronic equipment is pretuned in accordance with the best model available at the time of fabrication and shipping. This pretuning serves to minimize the time from the delivery of the equipment to the system being commissioned for full power operation.
Three tower in-line array with end towers’ series fed and center tower skirt fed with insulator segmenting upper half of the tower.
Comparison of Tower Measured Vs Calculated Self Impedances, Each With Other Towers Open Circuited
| Tower | Measured | Calculated |
|---|---|---|
| 1 | 44.5+j49 | 44.7+j53.3 |
| 2 | 81+j208 | 89.9+j200 |
| 3 | 47+j69 | 44.7+j68.2 |
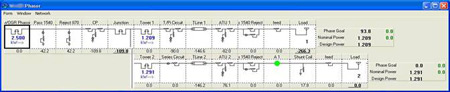
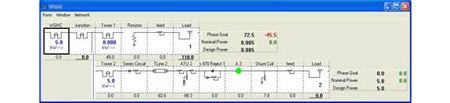
Power, phasing, and impedance characteristics from the method of moment model are the basis for the RF feed design. For sites with multiple stations, such as the diplexed operation of an omni-directional station onto a two tower array, the networks are interconnected as shown in the following block diagram. This allows the impact of the interconnected networks on both stations to be evaluated and the system designed for the best possible performance of both systems. In the case of new stations being added to existing arrays, the impact of the new stations can be determined by comparing the modeled performance of the existing array before and after the equipment is added.
Block Diagram of Diplexed Omni-directional Operation With A Two Tower Directional Array
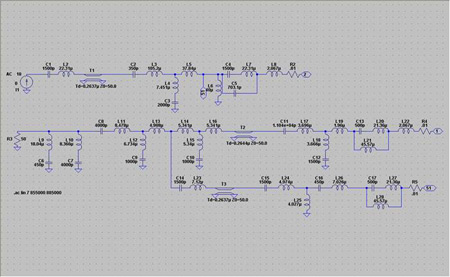
After the RF feed system is designed, its performance is verified via a Spice based nodal analysis. An equivalent Spice circuit for the antenna array modeled in NEC is generated and incorporated with the RF feed network over the frequency range of interest.
In this way, the design is verified at the station carrier frequencies and the side band performance can now be evaluated. This is particularly critical in the design of systems required to be IBOC-compliant.
Spice Model of Diplexed Omni-directional Operation On A Two Tower Directional Array
The results of the nodal analysis are imported back into the design software, where component and network changes can be made to improve the system bandwidth. The phase shift for the particular model of transmitter and that due to the interconnecting transmission line between the phasor and transmitter are typically modeled. This results in the input port of the circuit corresponding to the final amplifier of the transmitter, where the desired impedance sweep is symmetrical in resistance and has an “open” cusp to the left.
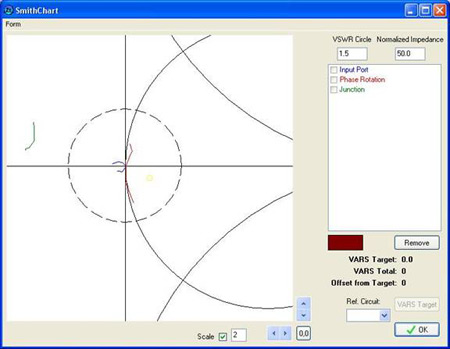
The following expanded view of a Smith Chart plot shows the effect on impedance bandwidth of a careful network design and component selection. The dashed line represents the 1.5:1 VSWR circle on the Smith chart. Portions of the constant resistance (50 Ohms) and constant reactance (±j50 Ohm) circles are visible. The green curve shows the frequency sweep at the common point of a phasing system with more than 6 towers. The red curve is the impedance sweep at the input to the T-network feeding the common point buss. In this design, an additional T-network along with shunt elements selected for reactance compensation have been added to produce the blue curve. The result is a symmetric, properly oriented, low VSWR load sweep for the transmitter final stage. This example highlights the necessity of using a system design approach to obtain the best possible performance.
Impedance Bandwidth Sweeps at Common Point, Common Point T, and Transmitter Finals.
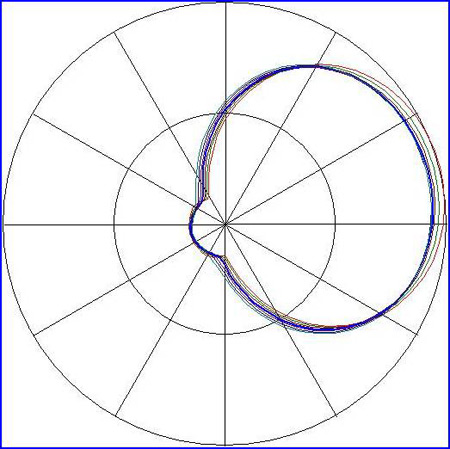
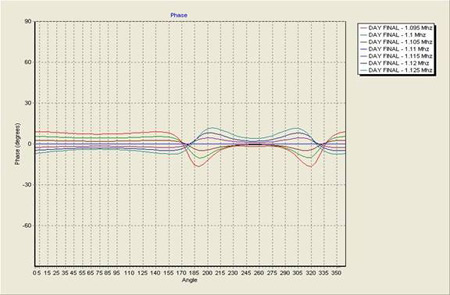
For a directional system, the pattern bandwidth of the array is just as important as the impedance bandwidth presented to the transmitter. The pattern bandwidth can be viewed as a measure of the quality of the transfer function formed by the RF feed networks and the physical configuration of the radiators in producing a particular pattern. The design goal is to minimize both amplitude and phase variation through the system. The last series of plots shows both a standard depiction of the antenna pattern of a directional array and a more detailed analysis of its magnitude and phase performance. In each case, the pattern at carrier is shown with the dark blue trace. Deviation in the field at sideband frequencies of ±5KHz, ±10 KHz, and ±15 KHz relative to carrier is shown as a function of azimuth angle in the traditional plot. The effects of amplitude distortion on the pattern shape and nulls can be quickly seen in this type of plot. The subsequent plots provide additional information and insight, showing deviation of both magnitude and phase using the field at carrier as reference. The current specifications for digital broadcast are far field amplitude variations of less than 2 dB and phase deviation of less than 9°/5KHz (27°/15 KHz) which is equivalent to a group delay of less than 5µsec.
The Kintronic Labs’ engineering staff is committed to continue to apply the most current and innovative design techniques to solving the needs of broadcast customers both in the United States and around the world.
Pattern Bandwidth Of Directional System at ±5, ±10, and 15 KHz
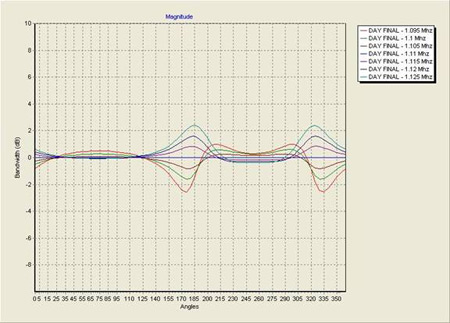
Normalized Magnitude and Phase For Pattern Bandwidth Evaluation
Other Related Links
International Propagation Studies
RF Feeder Design
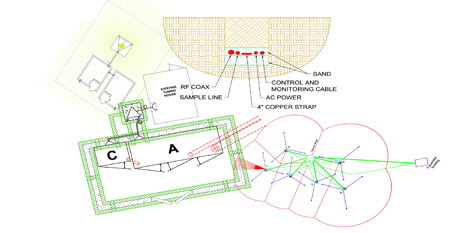
Site Plan Development